
One 15-minute window can set your electricity bill for the entire month. Most EV charging operators don't realize this until they see the invoice. They charge drivers (and pay for) energy - the cents per kilowatt-hour. But in commercial electricity tariffs, there is a second charge that can dwarf the energy bill: the demand charge.
Demand charges are fees based not on how much electricity you use, but on the single highest power spike your site draws in a billing period - sometimes measured over just 15 minutes. A single peak draw can set your bill for the entire month, and sometimes has an effect for the entire year. For a fast-charging hub with multiple simultaneous sessions, it can be the largest line item.
We looked at the raw data - thousands of public electricity tariffs from utilities across the US - and pulled out the demand and energy rates for the commercial ones - those most applicable to EV DC charging. A few caveats: some states have incentive programs for EV charging infrastructure that may temporarily waive demand charges completely (e.g. California) or partially substitute them with volumetric (energy) charges (e.g. National Grid's phase-in program in NY). Our analysis does not take into account those state-specific programs, and your mileage will vary. That said, the patterns are clear.
Here is what stood out:
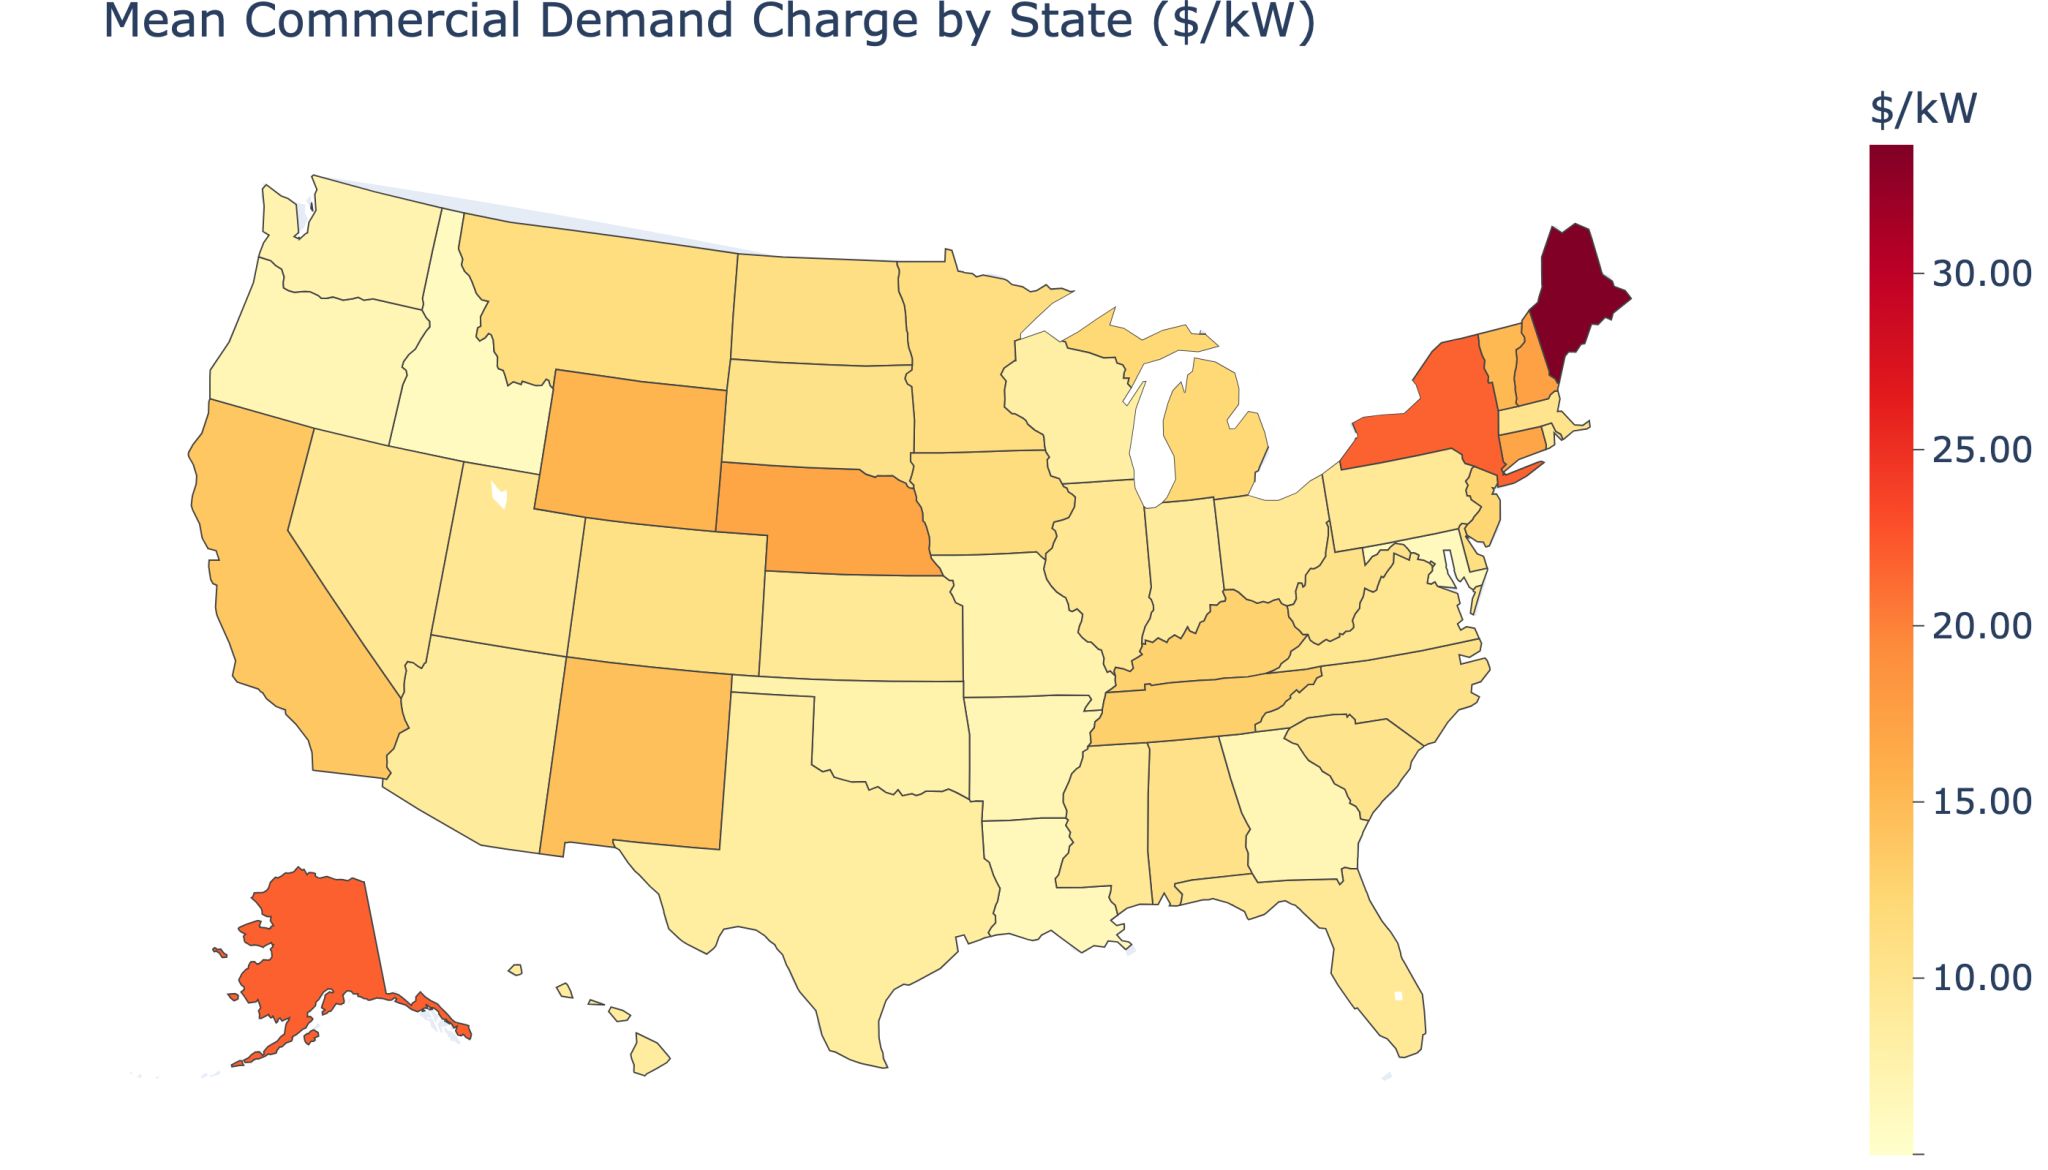
The demand charge spread is enormous. The national mean is $11.18/kW, but Maine sits at $33.65/kW - nearly three times the average. At the other end, Idaho comes in at $6.01/kW. The difference between the cheapest and most expensive states is 5X.
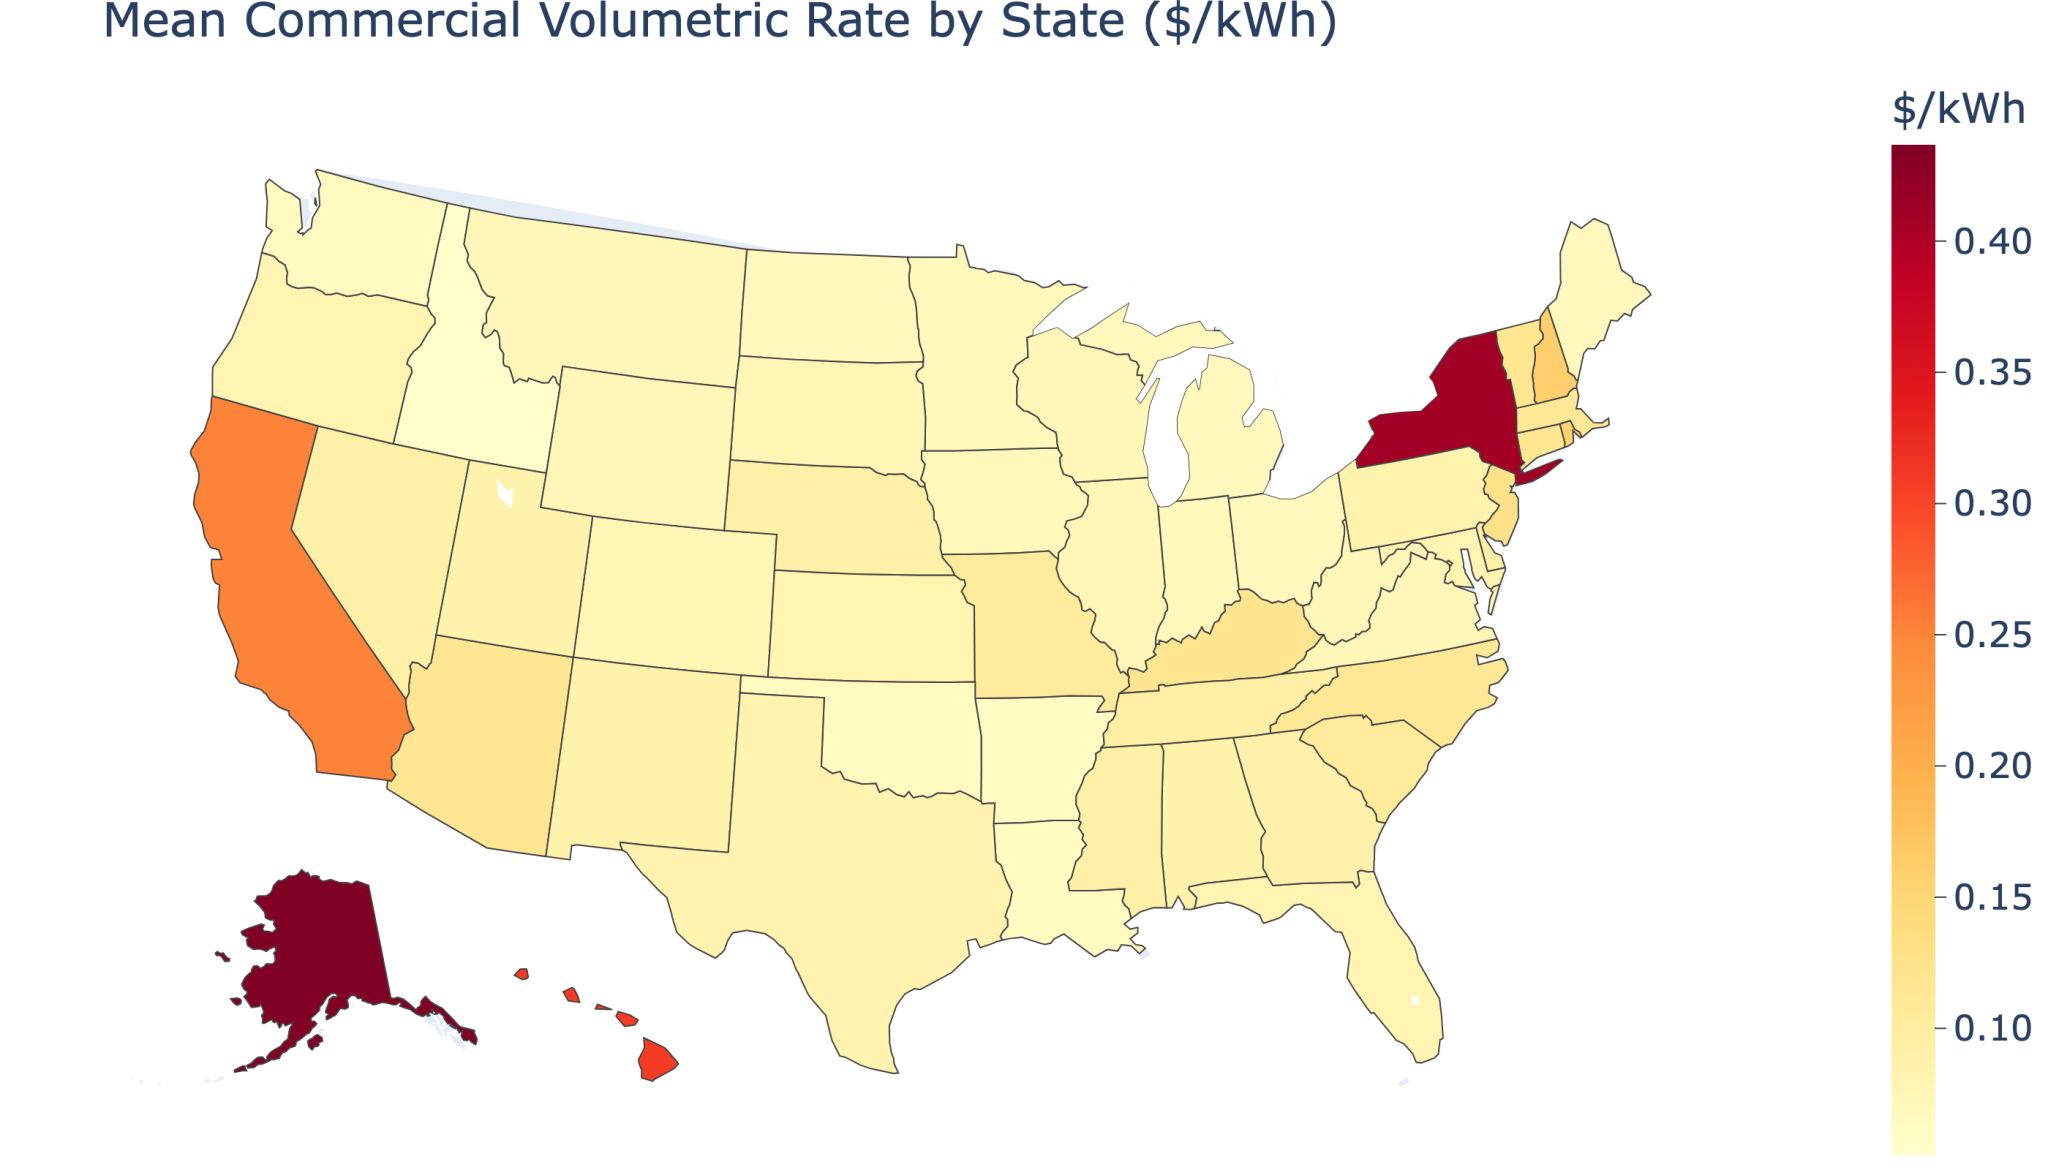
The energy ($/kWh) story is different. Alaska ($0.437/kWh), New York ($0.409), and Hawaii ($0.309) top the volumetric rankings - driven by island grid economics and dense urban infrastructure - while Idaho ($0.052), Arkansas ($0.063), and Louisiana ($0.063) are the cheapest for energy.
Only 456 of the 30,000+ commercial rates in the database (about 1.5%) specifically mention electric vehicles or EV charging. The rest are general commercial tariffs that EV operators are simply inheriting, often without realizing what they have signed up for.
This kind of rate-level analysis is something we do routinely at evPower.ai as part of evaluating charging sites. The optimal strategy for a charging hub in Bangor looks very different from one in Phoenix, and the difference is in the tariff structure, not just the hardware.
If you are planning or operating EV charging infrastructure and want to understand what your local tariff structure means for your economics, we are happy to run a free tailored analysis for your site. Send us your location and load profile and we will take it from there.
To profit from EV charging, it's critical master the details, demand charges structure today is one of many factors we take into account when managing your station.
Technical details for the data enthusiasts:
Data source: US Utility Rate Database (USURDB) - a public dataset maintained by the National Renewable Energy Laboratory (NREL) and OpenEI, containing nearly 63,000 electricity tariffs from utilities across the country.
Methodology:
- Filtered for approved, in-effect commercial sector rates (endDate null or in the future)
- Extracted max effective demand charge (rate + adjustment) across all time periods and tiers, from demandRateStrux or flatDemandStrux
- Extracted max volumetric rate from energyRateStrux on the same basis
- Per-state means were computed across all matching rates for that state. Mean is taken over all applicable tariffs, not over number of enrolled customers nor cumulative energy volume (that's more accurate, but we don't have access to this data).
Result: 5,836 commercial rates across 52 jurisdictions (50 states + DC + Guam).